
Single-cell foundation models vs established baselines
A Liatir Scientific Showcase · completed 5 October 2026
Pretrained single-cell foundation models did not show a uniform advantage over established baselines in this study. scGPT was competitive on PBMC, while PCA, Harmony and scVI remained particularly strong on Pancreas. The result depends on the dataset and the property being measured; there is no overall winner claim.
Study source, full results and evidence · Reproducibility archive and citation
Scientific question
Single-cell RNA sequencing measures gene activity in individual cells. An embedding is a compact list of numbers representing each cell, used to compare cells, discover groups and predict cell types. A foundation model learns such representations from a large collection of data before this evaluation.
Do pretrained embeddings preserve biological cell types and reduce differences between experimental batches better than established methods, and what resources do they require? A batch is a group of cells measured in the same experiment or with the same technology. Mixing batches is useful only if biological distinctions are preserved.
Datasets and methods
| Dataset | Cells | Genes | Cell types | Batches | Source |
|---|---|---|---|---|---|
| PBMC, peripheral blood mononuclear cells | 11,990 | 3,346 | 9 | 2 | scvi-tools 1.3.3 PBMC loader; original 10x PBMC8k + PBMC4k and scVI annotations |
| Pancreas | 16,382 | 19,093 | 14 | 9 technologies | scIB integration benchmark; official scvi-tools tutorial source, Figshare file 24539828 |
Source counts, cell/gene order and a seed-23 stratified 80/20 label split were fixed across methods. A seed fixes the random choices; stratification keeps cell types represented in both partitions. All cells remained in the common evaluation. Exact downloads, hashes, gene mappings and exclusions are recorded in the dataset manifest.
| Method | Representation used |
|---|---|
| PCA | Principal component analysis: a compact linear representation of 2,000 highly variable genes, using 50 components. |
| Harmony | Batch correction of the same PCA representation, using the recorded batch labels. |
| scVI | A probabilistic model trained on these datasets, with 30 latent dimensions and 100 epochs. |
| Geneformer V1 10M | Pretrained cell embeddings, without fine-tuning on these datasets. |
| scGPT whole-human | Pretrained cell embeddings, without fine-tuning on these datasets. |
| UCE 4-layer | Requested pretrained method; both configurations blocked and unscored. |
The five feasible methods completed on both datasets: ten measured configurations. scVI learned from all evaluation counts; PCA and Harmony also used all cells without test-label supervision. Only the classification training partition supplied labels to the classifiers. This tests hidden-label prediction within the datasets, rather than transfer to an unseen study or batch.
The frozen protocol specifies preprocessing, model inputs, clustering, classifiers and resource limits. Scientific parameters were fixed before scores were inspected.
Biological results
Logistic macro-F1 measures cell-type prediction with a fitted classifier, giving each cell type equal weight; 1 is perfect. ARI, adjusted Rand index, measures agreement between discovered groups and known cell types, with chance agreement accounted for. They measure different properties.
| Method | PBMC logistic macro-F1 | PBMC ARI | Pancreas logistic macro-F1 | Pancreas ARI |
|---|---|---|---|---|
| PCA | 0.92880 | 0.75318 | 0.97788 | 0.71291 |
| Harmony | 0.93241 | 0.70619 | 0.94953 | 0.92191 |
| scVI | 0.94916 | 0.54180 | 0.97184 | 0.52441 |
| Geneformer | 0.83946 | 0.28906 | 0.76435 | 0.05019 |
| scGPT | 0.95685 | 0.66926 | 0.89987 | 0.27478 |
On PBMC, scGPT had logistic macro-F1 0.95685, compared with PCA 0.92880 and scVI 0.94916. PCA had higher clustering agreement than scGPT. On Pancreas, PCA and scVI had logistic macro-F1 0.97788 and 0.97184; scGPT had 0.89987 and Geneformer 0.76435. Harmony had ARI 0.92191. These are observations from the fixed split, without uncertainty estimates.
The full report also includes nearest-neighbor classification, mutual information between groups and labels, and cell-type separation. All values at full precision, including UCE's null scores and causes, are in the twelve-row results table.
Batch results
Scaled iLISI measures local mixing of batches on a zero-to-one scale, with higher values indicating more mixing. Graph connectivity measures how much of each cell type remains connected in the graph of neighboring cells. Neither alone establishes a useful biological representation.
| Method | PBMC scaled iLISI | PBMC connectivity | Pancreas scaled iLISI | Pancreas connectivity |
|---|---|---|---|---|
| PCA | 0.78681 | 0.77356 | 0.00309 | 0.94257 |
| Harmony | 0.82647 | 0.77901 | 0.21006 | 0.88707 |
| scVI | 0.76160 | 0.93785 | 0.11818 | 0.93658 |
| Geneformer | 0.70082 | 0.76477 | 0.01433 | 0.50387 |
| scGPT | 0.74429 | 0.84780 | 0.00637 | 0.76947 |
Harmony showed stronger local batch mixing than the completed pretrained methods on both datasets by this measure. scVI's PBMC connectivity was 0.93785. Batch composition and geometry affect these scores; the full measured report also reports batch separation and mixing within cell types. No combined ranking was constructed.
Inspecting the representations
UMAP compresses the cell representations into two dimensions for inspection. Each dot is a cell and its color is the supplied cell type. Scores were calculated on the original representations, not on these pictures. Coordinates and apparent distances between separate UMAP plots are not directly comparable. The figures below are unchanged copies of the validated study figures.
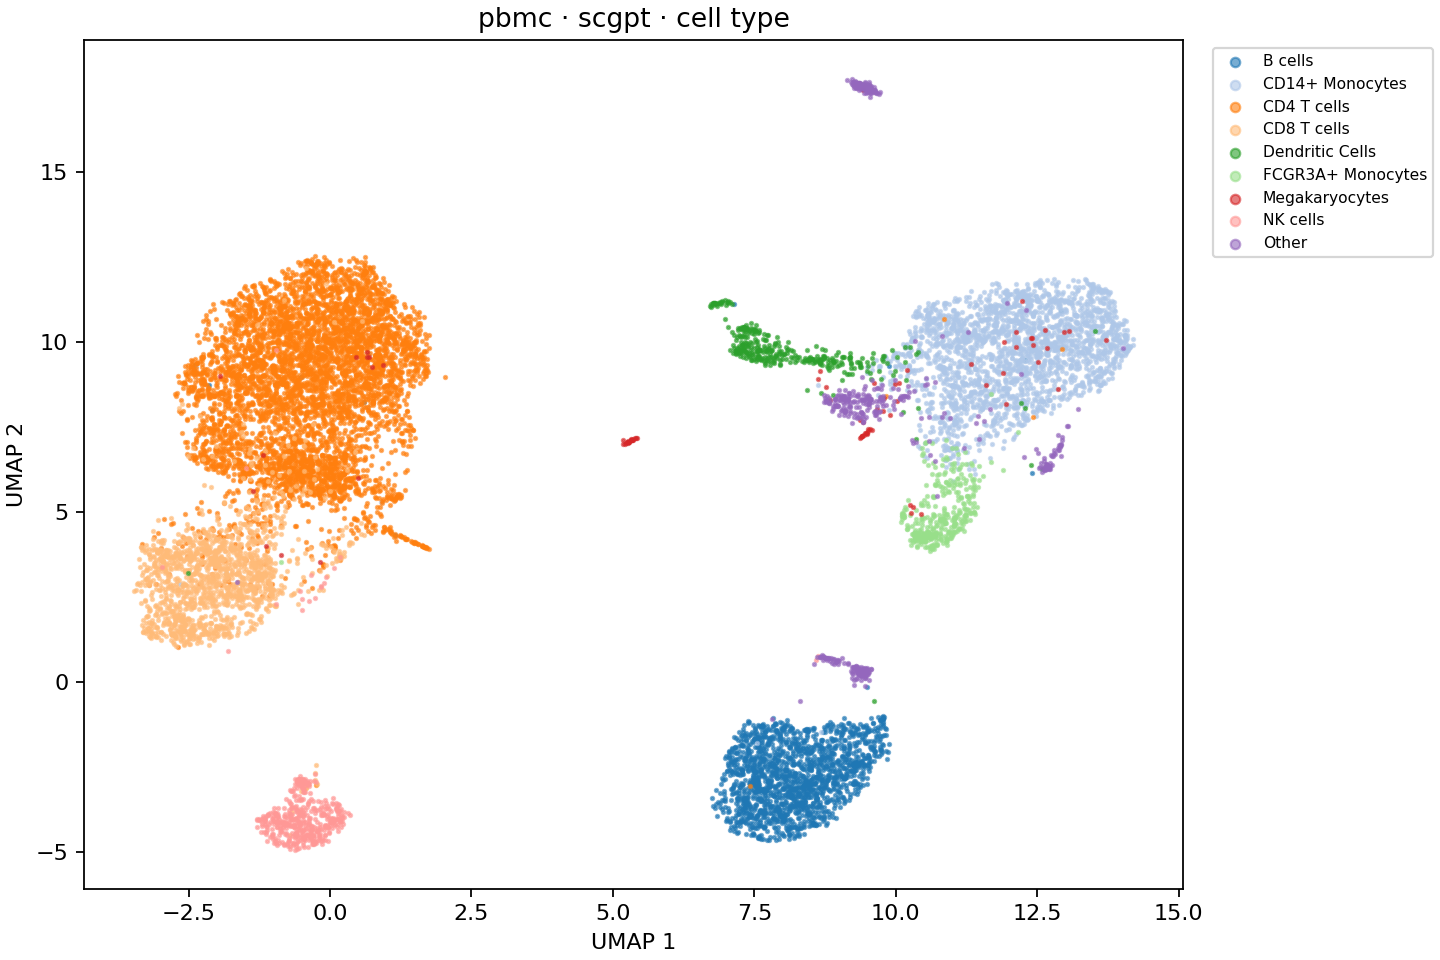
PBMC / scGPT: a visual view of the representation whose logistic macro-F1 was 0.95685. The plot does not establish superiority across the other metrics.
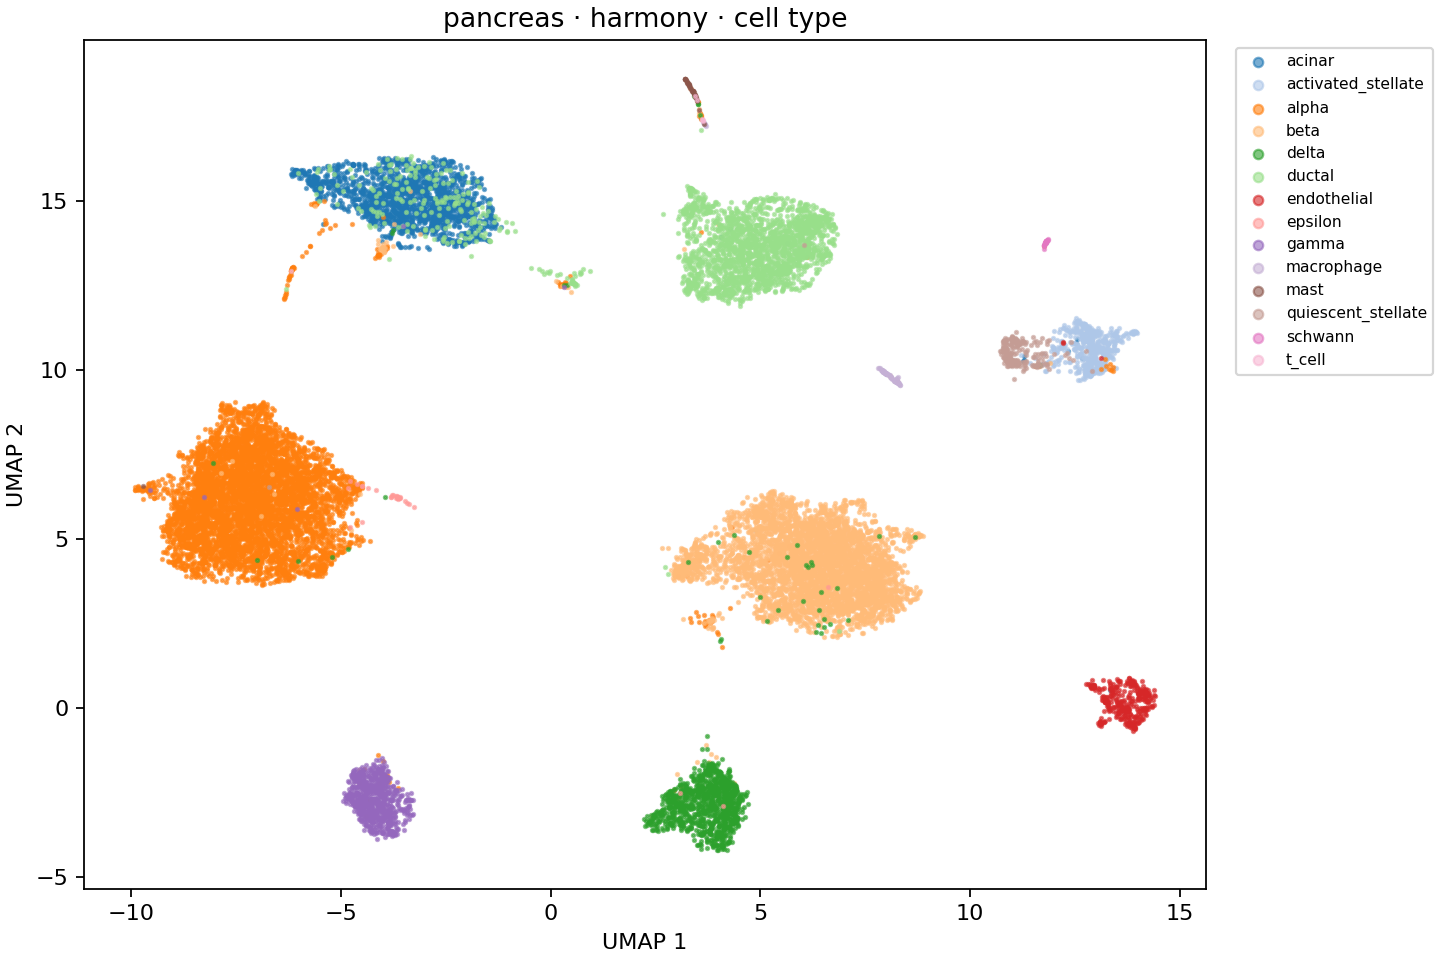
Pancreas / Harmony: the corresponding full-representation ARI was 0.92191.
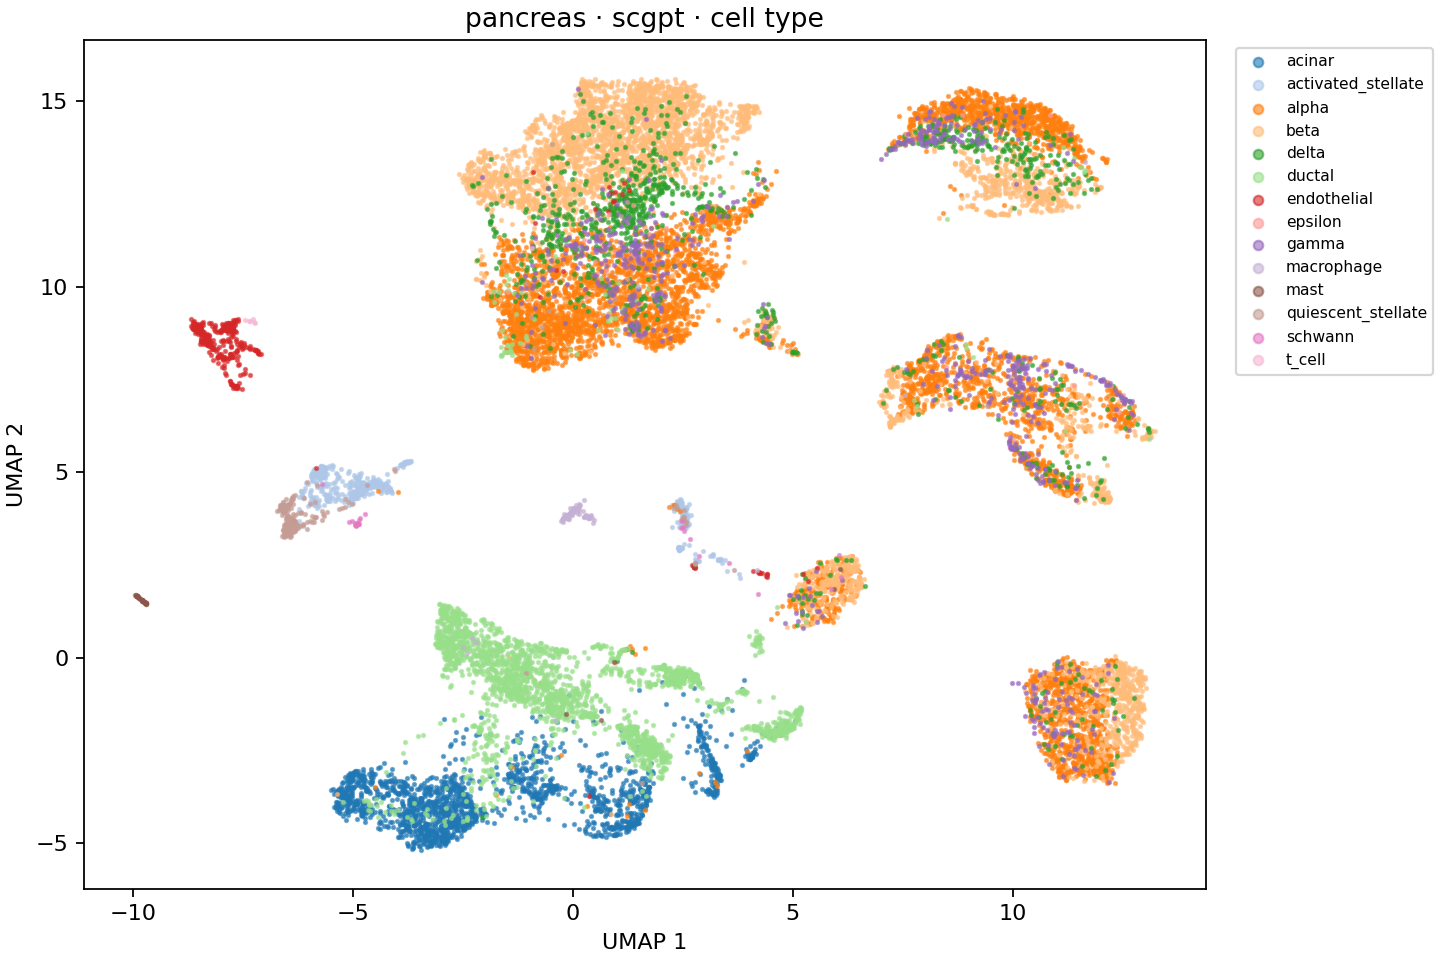
Pancreas / scGPT: the corresponding ARI was 0.27478. The measured biological and batch scores support interpretation alongside this visual inspection.
All 22 original figures include both cell-type and batch views for every completed configuration.
Computational measurements
Nine representations were produced on an Apple M1 with 16 GiB RAM, using CPU, one numerical thread, one-cell model batches and a 2 GiB process-family memory ceiling. Those saved representations and their measurements were reused byte for byte. Only the unfinished Pancreas scGPT representation was completed on an Intel i7-8700K / NVIDIA RTX 4060 Ti, through Linux Liatir in WSL2, the Windows subsystem for running Linux. That run used six threads, batches of 16, a 16 GiB workload RAM ceiling and a 6 GiB whole-GPU memory ceiling.
Representation time includes imports, preprocessing, model loading, inference or training, and serialization. Downloads, installation, common evaluation and UMAP are excluded. RAM below is the worker process's operating system high-water mark; GiB means 1,024³ bytes.
| Dataset | Method | Producer | Seconds | Peak worker RAM, GiB |
|---|---|---|---|---|
| PBMC | PCA | Mac / CPU | 7.51 | 1.192 |
| PBMC | Harmony | Mac / CPU | 15.20 | 1.210 |
| PBMC | scVI | Mac / CPU | 249.22 | 0.949 |
| PBMC | Geneformer | Mac / CPU | 804.10 | 0.681 |
| PBMC | scGPT | Mac / CPU | 4,994.07 | 1.153 |
| Pancreas | PCA | Mac / CPU | 7.94 | 1.799 |
| Pancreas | Harmony | Mac / CPU | 22.93 | 1.714 |
| Pancreas | scVI | Mac / CPU | 333.29 | 1.674 |
| Pancreas | Geneformer | Mac / CPU | 8,448.01 | 1.715 |
| Pancreas | scGPT | PC / WSL2 / CUDA | 515.54 | 2.346 |
Pancreas scGPT's GPU tensor peak was 3.269 GiB; the independent whole-device monitor measured 4,799,332,352 bytes, including graphics and other processes. The workload had zero swapping. CPU accelerator measurements are null, with their reasons recorded. Historical disk figures count file lengths through symlink aliases and are not physical disk usage; the separate PC disk audit retains that distinction.
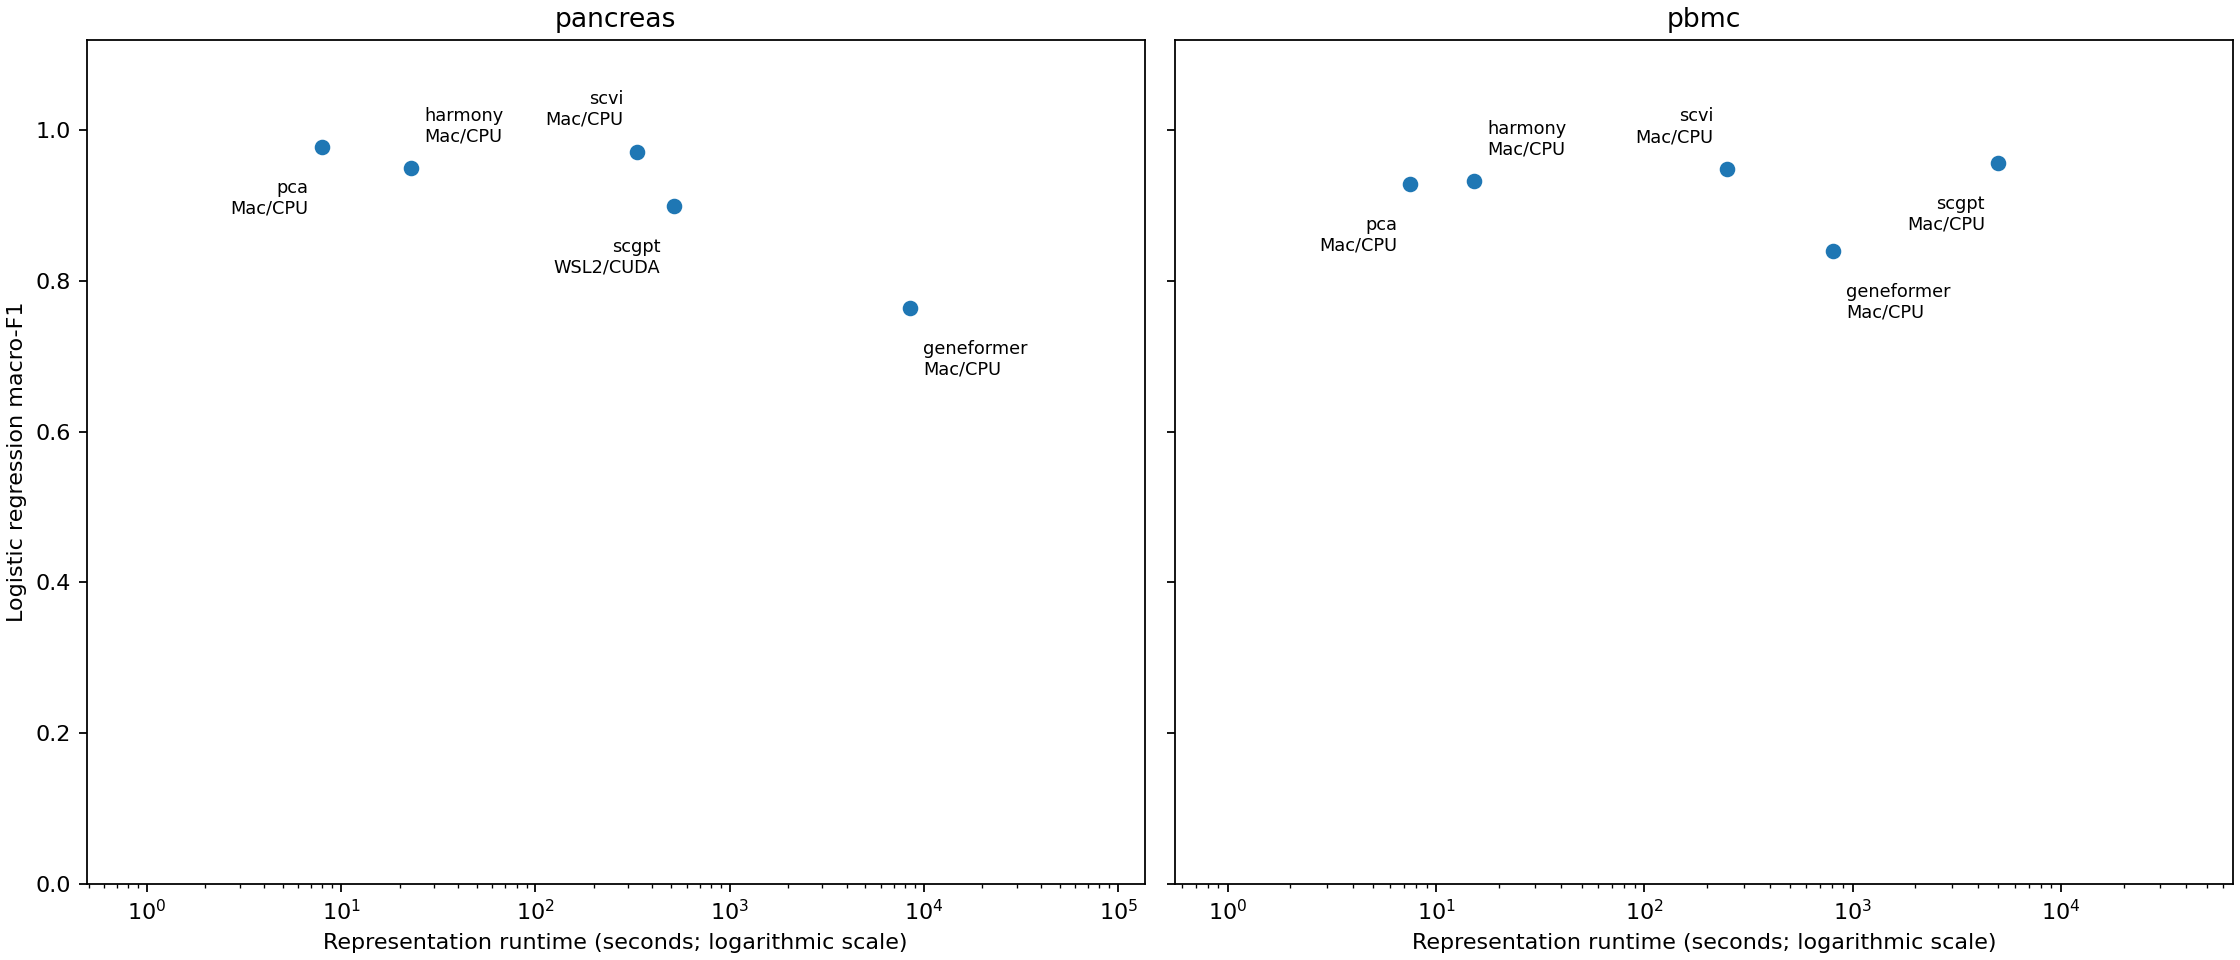
The runtime axis is logarithmic. Pancreas scGPT uses different hardware and resource limits from the other points, so this is not a same-host speed ranking. The full compute table also preserves model identities, embedding sizes and measurement scopes.
Interpretation and limitations
Pretrained representations were useful in some measured settings, especially scGPT cell-type prediction on PBMC. The observations do not support a uniform advantage over established approaches. Biological preservation, batch mixing and resource use should be assessed separately for the intended analysis.
- Two datasets, one seed. There are no confidence intervals or statistical superiority claims. Rare Pancreas labels further limit interpretation.
- Within-dataset evaluation. scVI was trained on the evaluation datasets; unsupervised fitting used all cells. The label split is not a held-out study or batch. Possible overlap with foundation-model pretraining data was not ruled out.
- Input constraints. PBMC uses a historically selected 3,346-gene subset. Pancreas contains fractional quantification values, preserved without rounding; integer count-model assumptions are imperfect. Each pretrained model uses its required vocabulary and input transformations.
- Heterogeneous hardware. The Mac and PC costs cannot establish a same-host performance ranking. RAM and GPU measurements have different scopes. Historical interrupted work is retained separately from the fresh complete GPU runtime.
- UCE has no scientific scores. On the original Mac, its checkpoint tensors exceeded the approved 2 GiB budget. On the PC, no signed Linux UCE target was published. These are execution blockers, not evidence of poor representations or inability to run with more resources.
The complete limitations and failed/interrupted attempts remain in the technical package.
What Liatir handled
The study ran through Tools → Single-cell study in the compiled desktop app. Liatir handled model installation through AI Models, dataset preparation, the study's analysis steps, resource safeguards, logs and progress in Jobs, and measurements, charts and export in Results. Saved runs had their own workspace and run identities. Reuse required matching data, split, code and embedding checksums, which identify the exact saved contents.
Before the complete GPU run, real interruption/resume produced exactly equal vectors, and incompatible identities and impossible resource limits were refused. The final verification used a native Linux app under WSL2 with a virtual display and a development frontend; it does not certify a Windows release package.
Independent evaluation reproduction matched all completed biological and batch scores at absolute tolerance 1e-9 and relative tolerance 1e-8. Original source-count checks passed exactly, including all fractional Pancreas values. The historical repository, native UI and scientific regression checks are detailed in tested reproduction and execution evidence.
Reproduce and cite
Use Liatir's visual interface to repeat the study:
- Choose a workspace and make the required models available through AI Models.
- Open the single-cell study in Tools. Select PBMC and the study's six methods: PCA, Harmony, scVI, Geneformer, scGPT and UCE.
- Use the complete dataset rather than the small-sample stability check, and choose an execution setting supported by your computer.
- Start the study and follow progress and diagnostics in Jobs.
- Inspect the measurements, figures and any blocked methods in Results, then export the study.
- Repeat for Pancreas with the same scientific settings.
Liatir handles the preparation and execution; initial downloads require an internet connection. Unavailable models and resource limits remain explicit blockers. New runs record their own model versions, hardware and execution costs. Continuing a saved study reuses verified completed work and preserves its original history.
Reproducing the study in Liatir
GitHub tracks the protocol, source, dataset/provenance manifests, small result tables, all figures and validation evidence. Zenodo holds the complete large reproducibility bundle, approximately 1.8 GB, including data and saved results that are deliberately outside Git. Download the original study artifacts and cite them through 10.5281/zenodo.23187931. Use the record's citation metadata when citing the archive.